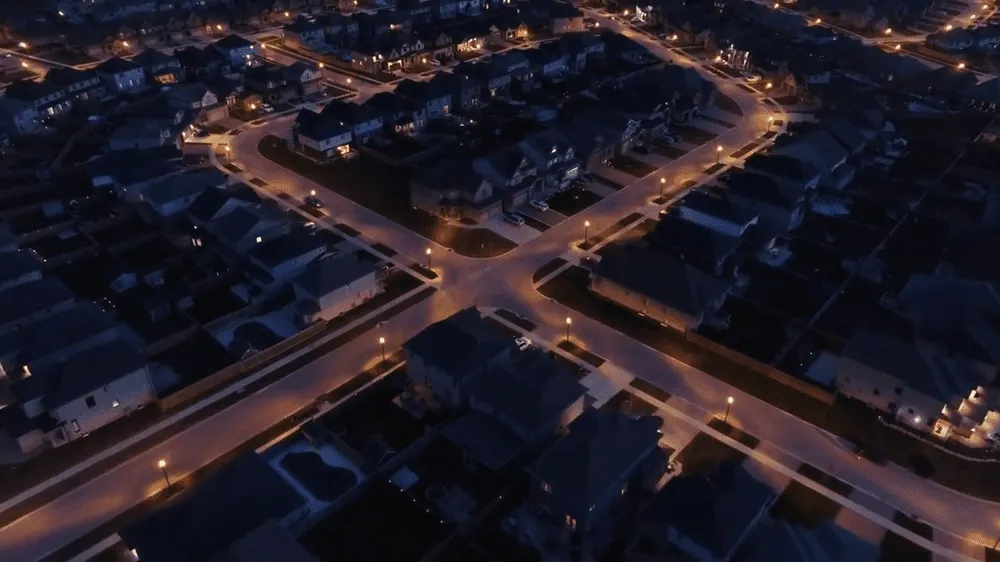
App Screenshots
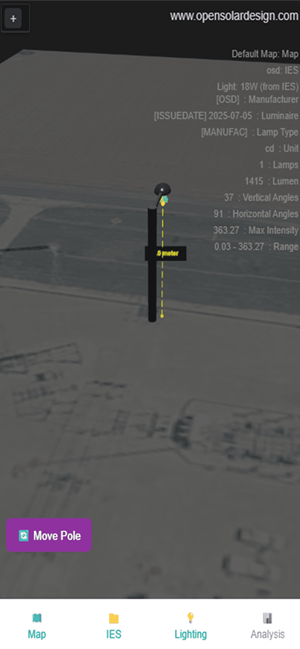
View
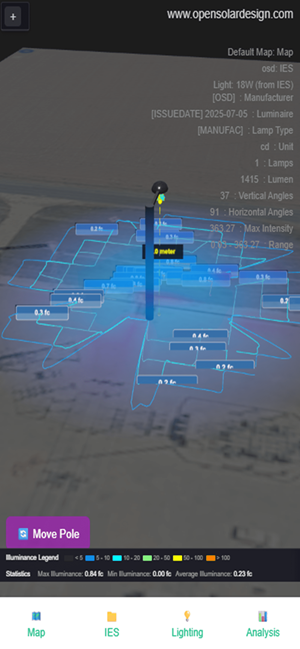
Light Distribution Visualization
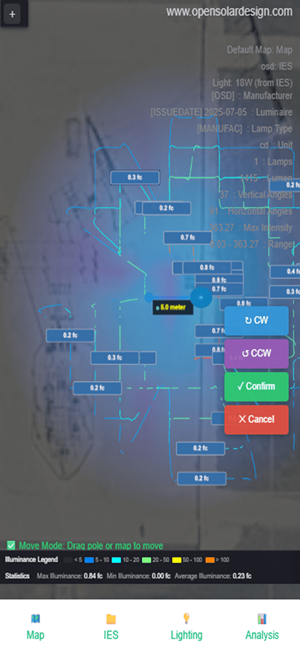
Analysis Results
Live Demo — IES Lighting Simulation
Upload an IES file and see real-time 3D lighting simulation directly in your browser.
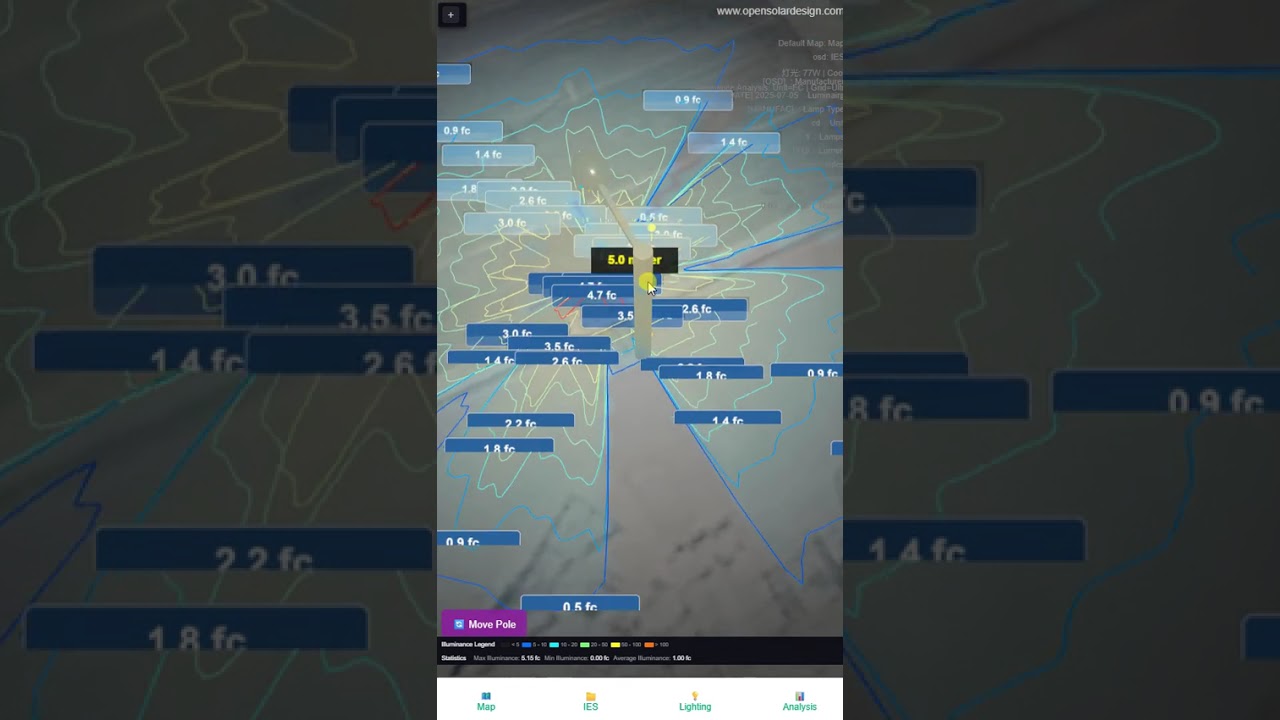
IES 3D Lighting Simulation
Professional IES file viewer and 3D lighting visualization tool for solar street lights. Upload IES photometric files, visualize light distribution in multiple view modes, analyze illuminance statistics, and generate professional lighting analysis reports.
Key Features
IES File Upload
Load and parse IES LM-63 standard photometric files from LED fixture manufacturers with preview visualization before confirmation.
Multiple View Modes
Switch between Curve, Particle, Surface, and Combine visualization modes to examine light distribution from different perspectives.
Map Integration
Upload custom site maps or use default map, with distance measurement tool to calibrate scale for accurate lighting analysis.
Lighting Settings
Configure power settings (1W-500W) and color temperature (3000K, 4000K, 5000K, 8000K) with real-time intensity preview.
Illuminance Analysis
Calculate illuminance levels with unit selection (Lux/FC), adjustable grid resolution (Low to Extreme), and pole height configuration.
Comprehensive Statistics
View Max, Min, and Average illuminance statistics with color-coded legend for quick visual assessment of lighting performance.
Technical Specifications
| Platform | Android (HTML5 Web App) | IOS/OS (coming soon) |
| Core Features | IES File Viewer, 3D Lighting Simulation, Illuminance Analysis |
| View Modes | Curve, Particle, Surface, Combine |
| Illuminance Units | Lux, Foot Candles (FC) |
| Grid Resolution | Low, Medium, High, Ultra, Extreme |
| Power Range | 1W - 500W |
| Color Temperature | 3000K, 4000K, 5000K, 8000K |
| Statistics | Max, Min, Average Illuminance |
| Export | PDF Report Generation |
Frequently Asked Questions
What is IES LM-63 standard?
IES LM-63 is the standard format for photometric data files used by lighting manufacturers. It contains detailed information about light intensity distribution, manufacturer data, lamp type, lumens, and angular measurements.
What do the different view modes show?
Curve mode shows intensity distribution curves, Particle mode visualizes light rays as particles, Surface mode displays a colored surface map, and Combine mode merges all visualization types for comprehensive analysis.
How do I use the map measurement tool?
Upload a site map, tap two points to mark a distance, enter the actual distance in meters or feet, and click "Set Scale" to calibrate. This allows for accurate placement and analysis of lighting on real-world layouts.
What does grid resolution affect?
Grid resolution determines the density of calculation points on the surface. Higher resolutions provide more detailed illuminance maps but require more processing power. Use Extreme only for critical analysis.
Thank you for choosing Open Solar Design